
In 2015, global business and government leaders including Shell and BP signed the landmark Paris Climate Agreement. While sustainability discourse typically emphasizes corporate climate commitments and financial results, this analysis examines supply chain sustainability for both companies. Supply chains represent the most effective mechanism for enterprise-scale change acceleration.
Sustainability Ratings Overview
ESG data sourced from CSRHub uses a 0–100 scale (100 = positive rating).
Current sustainability ratings: BP = 53; Shell = 54
BP’s Performance Trajectory
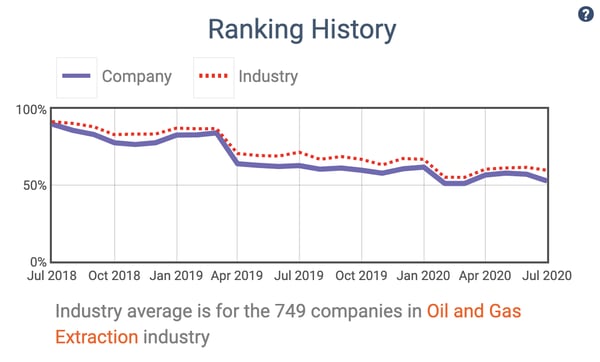
Figure 1 illustrates BP’s ESG rating evolution against industry benchmarks over time. BP has consistently performed inline or slightly below industry average, with both BP and sector-wide downward trends indicating movement away from sustainable targets.
Supply Chain Analysis
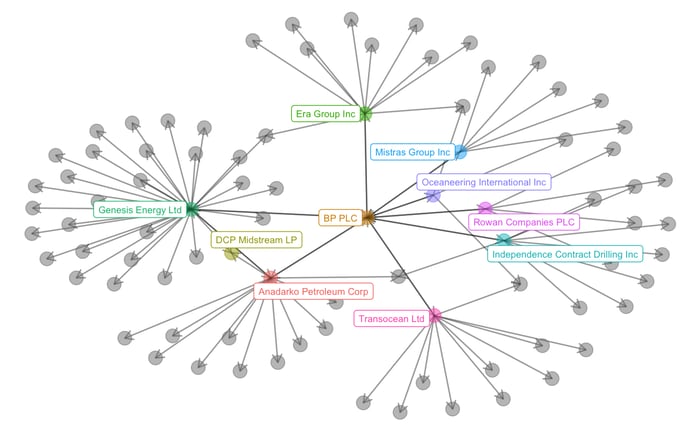
Using Inferess’s global supply chain dataset mapping economic linkages, the analysis obtained ESG ratings for each BP supplier.
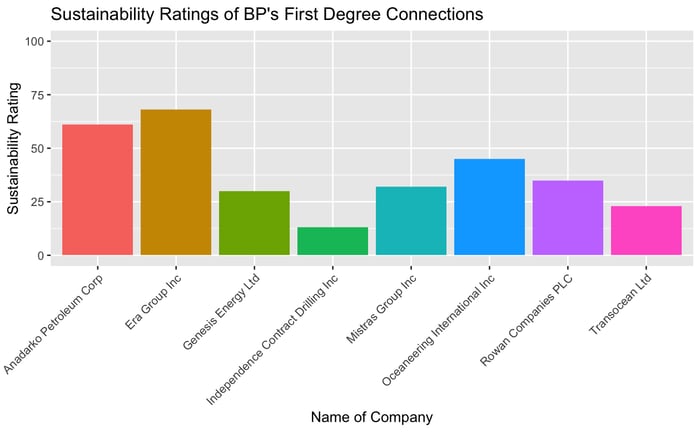
First-Tier Results
| Metric | BP | Shell | Difference |
|---|---|---|---|
| Minimum | 13.00 | 5.00 | 8.00 |
| Maximum | 68.00 | 40.00 | 28.00 |
| Mean | 38.38 | 21.20 | 17.18 |
| Median | 33.50 | 22.00 | 11.50 |
BP demonstrates a more sustainable first-tier supply chain than Shell. This advantage stems partly from Era Group Inc’s ESG rating of 68.00, suggesting BP’s immediate suppliers align more closely with sustainability objectives.
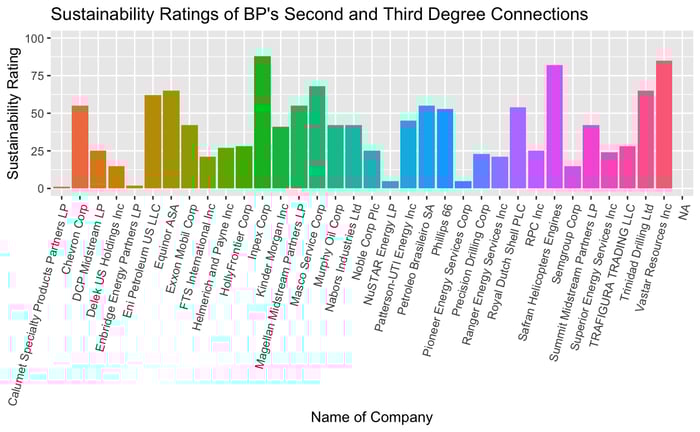
Second and Third-Tier Results
| Metric | BP | Shell | Difference |
|---|---|---|---|
| Minimum | 1.00 | 2.00 | -1.00 |
| Maximum | 88.00 | 79.00 | 9.00 |
| Mean | 38.03 | 38.65 | -0.62 |
| Median | 41.00 | 40.50 | 0.50 |
When deeper supply chain tiers are included, sustainability ratings converge between BP and Shell, indicating comparable performance at indirect supplier levels.
Conclusion
Sustainable supply chain practices address global challenges including climate change, resource depletion, and modern slavery through comprehensive performance monitoring across diverse supplier networks.
The analysis reveals BP maintains a greener first-degree supply chain; however, both organizations demonstrate equivalent performance in secondary and tertiary tiers. Meeting Paris Climate Agreement standards requires both firms to reassess their broader supply chain ecosystems to ensure value and message alignment throughout supplier networks.